
In recent years, traditional portfolio constructions -- most notably the classic 60/40 equity/bond allocation -- have served investors well. They are simple, have been effective over the long term, and have historically offered diversification.
In recent years, traditional portfolio constructions -- most notably the classic 60/40 equity/bond allocation -- have served investors well. They are simple, have been effective over the long term, and have historically offered diversification.
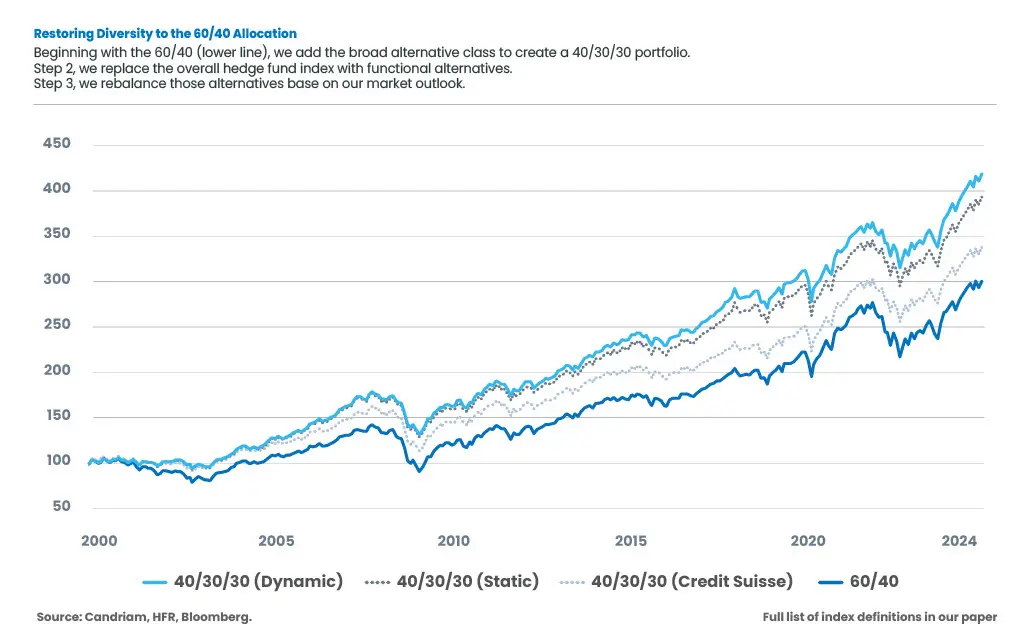
We have previously examined the equity/bond allocation and asked, ‘Is 40/30/30 the new 60/40?’ Well, yes, we think it is. Our work shows a long-term correlation between equities and fixed income that is frighteningly close to 1.0.[1] This increased correlation fundamentally alters the effectiveness of traditional portfolio construction.
Labels and descriptions such as ‘uncorrelated’ may not provide the full picture of how an alternative strategy behaves in different types of financial markets. We test a diversification using alternatives based on their function
Part of the longevity of the familiar 60/40 equity/bond allocation is its simplicity, and its historical success.
We believe we have developed a 40/30/30 methodology that can be simply implemented – for large and small investors alike.
Our white paper, and the results we summarize here, include scenarios which reflect the hypothetical historical performance of combinations of indices, not all of which can be replicated. These examples are hypothetical and is for illustrative and educational purposes only; they do not reflect actual investment results.
[1] Source: Candriam, 7 May, 2025. Based on the MSCI World (Equity) Index and Bloomberg US Treasury Index, both for the period of our white paper, 1999 to 2025, the correlation was 0.97, and for the longer period of 1980 to 2025, the correlation was 0.98.
Get information faster with a single click