
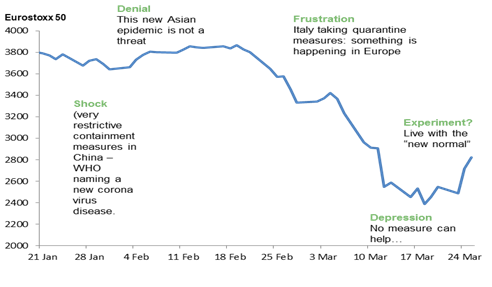
In this unprecedentedly fast correction, our world has changed in a few weeks, forcing us to adapt as fast as we can to a “new normality”. Covid-19 is one of the black swans that we feared. The evolution of Investors’ psychology is particularly important to take into consideration: we are all impacted – as investors and as individuals. About half of humanity is now confined. So, how did we react to this “emotional” shock? Until last week, we were clearly in the “depression” phase. Despite proactive central bank and government announcements, we continued to see historical sell-off days on equity and bond markets. Typical for a “depression” phase, we were not seeing any light at the end of the tunnel. This week, sentiment seems to be improving: we are progressively moving to an “acceptance” phase, are starting to explore options and are more able to turn to the future. We are not completely out of the woods yet, but investors seem to be willing to be more constructive.
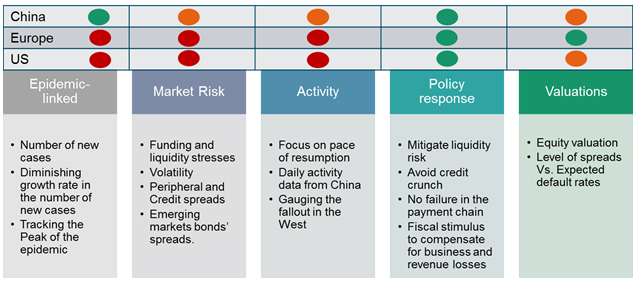
What are the conditions for a market trough? We are closely following 5 sets of indicators that are for us essential for a sustainable market rebound.
- Epidemic-linked indicators
This is the starting point and those indicators are key in this crisis. We are following the growth rate in the number of new cases. We will be reassured once we ascertain the positive impact of the containment measures. This is already the case in Italy, and other European countries should see improvements in the coming days. But it is not the whole story. Government strategies to exit confinement are now even more important. Although governments cannot maintain containment for too long without destroying the economic fabric, they will run the risk of a second “wave” of cases if they relax confinement too quicky. In the US, Donald Trump is clearly eager to risk an early exit. In Europe, there is no clear strategy for now. Governments are exploring several avenues but geolocation via smartphone tracking, for instance, would be perceived as a threat to individual privacy and liberty.
- Market risk indicators
The situation is improving compared to last week on this point. For the market to recover more sustainably, investors have to put a limit to this tail risk. The current bear market should not turn into a global financial crisis. Central bank actions have successfully mitigated liquidity and funding stresses. Indicators relating to USD funding issues or liquidity conditions in the US treasury market, for instance, are normalizing. But this is not yet the case for many fixed income markets. High Yield and Emerging Debt spreads are slightly decreasing but many markets remain partly dislocated.
Volatility is another indicator of market stress. Volatility measures such as the VIX index (US market) or the V2X (Eurozone) remain at a high level but are decreasing. This is a positive signal, but not yet sufficient. Market troughs are usually reached when volatility indices decrease.
- Activity indicators
Just as for market risk indicators, to find a bottom, investors have to be able to put a limit on the economic damage. Will containment last 1, 2, 3 months? Will we have full containment? Is there a risk of a second episode of confinement? What is the size of the economic shock? The pace of activity resumption in China could give some clues enabling projections to be made for Europe and the US. The problem for the US is that there is no clue yet on the breadth and length of the confinement policies and hence on their economic impact. This should continue to weigh on sentiment.
- Policy response indicators
We are following the size of the fiscal support and monetary policy decisions. This is the most supportive factor for now. It has allowed a market rebound this week. We consider that government and central bank responses are proactive and sufficient for the time being to mitigate the economic impact. Global fiscal support is above 2.5% of global GDP. It is not a “stimulus”, it just aims at compensating business and household revenue losses (1% fiscal support for 1% GDP lost). On the central bank side, besides massive injections of liquidities, there seems to be no limit to creativity and unconventional monetary policy measures.
- Valuation indicators
Valuation is never a trigger for a rebound but it must be low enough to incorporate much of the bad news. Although valuations have already rebounded since last week, we consider that they had reached a bottom in Europe (PE around 10) and had dropped by more than 30% in the US, which was in line with the median of a correction. In the fixed income markets, High Yield spreads in the US implicitly integrated a default rate of 8-9%. The equity risk premium was also back at 2008 levels in the US and in Europe because of the drop in valuation and the low level of yields. Valuation indicators were pointing to an attractive risk-reward last week.
How are we positioned in our diversified funds? Since 25 February we have been underweight equities and had protected the equity part with derivatives strategies. Last week, we acknowledged a better risk-reward after a 35% drop on European and US equity indices. We are gradually increasing our equity exposure, with the objective of becoming neutral in the coming weeks. On the bond side, we have kept our exposure to credit and emerging debt. We also remain invested in gold as a hedge and a diversification to our bond allocation.