
Are climate measurements good enough for balance sheets?
If France relies on its nuclear power, it will not do what is necessary in terms of renewables, says the German side. When it comes to importing disgusting LNG from shale gas or running its coal-fired power plants, Germany is less careful, comes the retort from west of the Rhine.
In Brussels, the nuclear war between Germany and France is raging, Le Monde, March 5, 2023 at 06h03, updated March 6, 2023 at 11h42
Although the scientific consensus on climate change is now widely established, the political consensus is not. It is in this context that the European regulator for insurers and pension funds (EIOPA) opened a consultation to introduce capital charges for ESG risks, with a specific focus on transition (climate) risk on the asset side.
1. Increasing initiatives to measure the financial risks associated with ESG risks in general, and climate risks in particular
Since 2018, several studies on sustainability risks have been conducted by central banks:
- Climate stress tests conducted by the Dutch National Bank[1]
- Bank of England climate stress tests[2]
- Pilot study on climate by ACPR[3]
- Stress tests for pension funds organized by EIOPA[4]
EIOPA’s current consultation, opened in December 2022, continues the precedent of its previous in utilizing scenarios from the NGFS (Network of Central Banks and Supervisors for Greening the Financial System). In particular, this discussion emphasises transition risks. The impact of transition risks on financial valuations directly influences the value of insurers' investments, and therefore their solvency. We highlight some of the methodological aspects below:
2. Should climate risk calculations be based on the sector of activity, or the individual characteristics of each company?
Sector-wide approaches -- a difficult calibration and a counterproductive measure?
Sectoral approaches are based on the notion of industry relevance to climate policy, i.e. those sectors which emit the most greenhouse gases (GHGs). Examples include fossil fuel extraction and refining, energy production, energy-intensive industries, construction, transportation and agriculture.
The performance and volatility (risk) graphs demonstrate that performance and risks vary by sector, but carbon intensity is not the only factor explaining these variations.
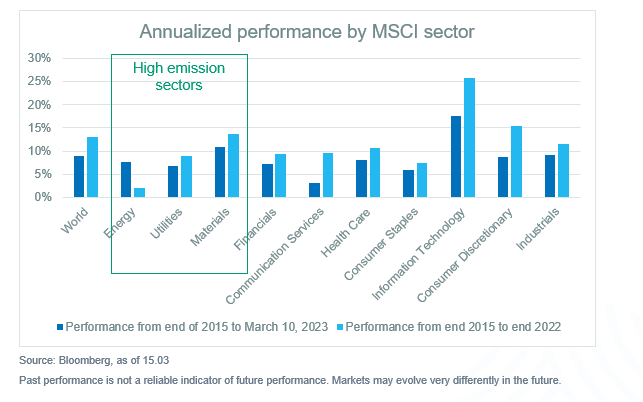
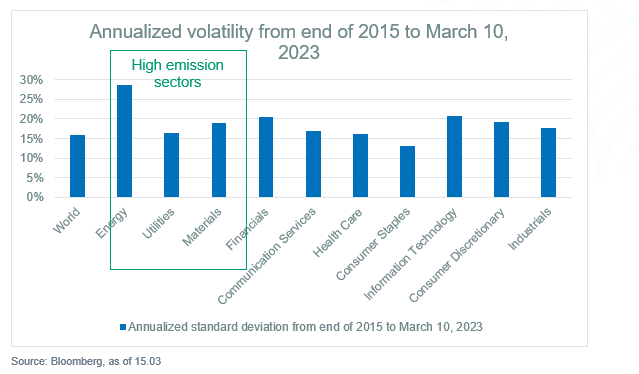
Past performance is not a reliable indicator of future performance. Markets may evolve very differently in the future.
There are other drawbacks to the sectoral approach.
- Unexpected capital allocation incentives? -- This type of measure might cause investors to simply reallocate capital away from industries at risk of transition We need these industries to be actors of climate change. By contrast, service, media or health companies are less able to decarbonize the overall economy.
- Type of classification system? -- The sectoral classification, which brings together economically substitutable activities, is not an environmental classification. The NACE classification is widely used by European regulators for stress testing. At its most precise level, the classification groups together "the operation of power generation facilities, including thermal, nuclear, hydroelectric, gas turbine, diesel and other renewable energy generation" under code D.35.11. That is, all possible sources of energy, carbonaceous or not.
- Granularity? -- Finally, companies may be exposed to several types of activities and therefore a single NACE code may be insufficient. For example, NACE code C.29.10 covers the manufacture of motor vehicles, excluding in particular the manufacture of batteries for motor vehicles (code C.27.20).
Individual approaches, a data problem
Characterizing ESG risks therefore requires more company-specific data. For this, it is necessary to have greater granularity of data, including predictive data. The hurdles include the cost of producing, acquiring, structuring and processing this data, which can be unaffordable for small players in the insurance market.
The data currently available are of two types -- data from professional suppliers and internal data from management companies and other investors. Both have major drawbacks. The former are essentially commercial and reflect the work and views of a specific private actor. The latter are not available to the general public in sufficient detail. These are likely to reflect methodological inconsistencies from one database to another, as well as quality problems.
Several regulations should allow the necessary data to be enhanced by enriched, harmonized and probably less costly information, as it would be reported by the companies themselves. In particular, alignment with the Taxonomy should combine:
- A breakdown of the company's activities by NACE code(s) to define their relevance to sustainability objectives
- Quantitative and/or qualitative criteria to define their level of alignment with these objectives, linked to KPIs which can be physically measured, eg, carbon emissions per quantity of energy produced.
Taxonomy is a promising tool for measuring climate risk. However, actors must be allowed time not just to assimilate these new requirements, but perhaps also to accompany the implementation and interpretation of these directives, which are not always unequivocal.
3. Should financial risk be calibrated on market indices, or on portfolios of securities according to their sustainability?
Calibration by market indices, a simple but inconclusive approach
Market index providers such as MSCI produce "Paris-Aligned" indices that could be natural sources for calibrating the financial risks associated with climate risk. However, the performance of the Paris-Aligned indices and the market at large are quite similar, and the difference between their risks is not significant from a purely statistical point of view.
Calibration issuer by issuer, a finer but also more complex approach
A calibration across a sector or sectors of activity, which includes a specifically climatic measure, seems more useful -- but also more complex to implement.
Again, the first difficulty is the availability and processing of financial data on the one hand (e.g. processing of corporate ACTIONS) and ESG data on the other (relevant indicators per activity). Using that date which is currently available, however, already shows some trends. We compare the annualized equity performance and carbon emissions per quantity of energy produced within the energy-producing sector.
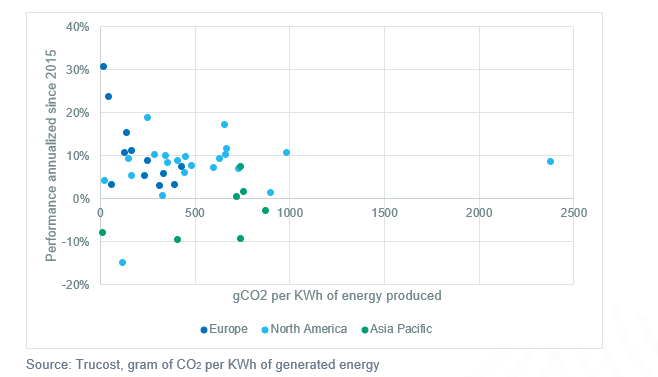
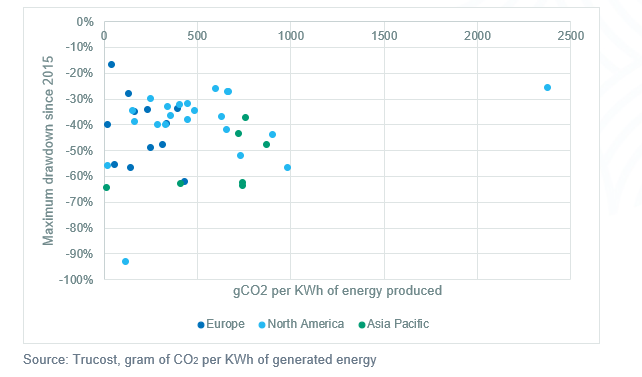
Carbon intensity seems to be negatively correlated with equity performance in Europe, and still present although less so for the rest of the world. This probably results from the European environmental policy, which, although imperfect, is much more advanced than in most parts of the world.
The second difficulty is assessing the relative importance of strictly financial risks and environmental risks. A major international oil company with large, high-value reserves and an industrial company with free emissions allowances should still be able to pay attractive dividends in the coming years. A small innovative company will be more exposed to competition, and will have fewer and less-diversified resources available. Over a longer time horizon, however, the trend is likely to be reversed as the consequences of climate change become more financially material.
Are we ready to quantify climate risk in insurance capital calculations?
The calibration of capital requirements for the transitional risks borne by insurers' assets faces many practical difficulties. Some can be overcome by the greater information reporting by the issuer companies.
Yet a conceptual difficulty remains: the gap between prudential requirements that reflect a Value at Risk at one year calibrated on historical prices, and a climate change whose consequences will only be fully measured in the rather distant future. We can also ask ourselves if the fight against climate change would not better aided through more direct actions, such as a full internalization of the costs of climate change in the economic activities concerned or by industrial policies of adapted and significant investments.
EIOPA – European Insurance and Occupational Pensions Authority.
ESG – Environmental, Social, and Governance.
NACE – Nomenclature statistique des activités économiques dans la Communauté européenne, the Statistical classification of economic activities in the European Community.
KIP – Key Performance Indicator

[1] 201810_nr-_7_-2018-_an_energy_transition_risk_stress_test_for_the_financial_system_of_the_netherlands.pdf (dnb.nl)
[2] Insurance Stress Test 2019: feedback for general and life insurers (bankofengland.co.uk), Key elements of the 2021 Biennial Exploratory Scenario: Financial risks from climate change | Bank of England , Bank of England report on climate-related risks and the regulatory capital frameworks | Bank of England
[3] 20210602_as_exercice_pilote.pdf (banque-france.fr)
[4] 2022 IORP Climate Stress Test Report (europa.eu)


