In the United States, the disinflation process is clearly underway, as the heatmap below illustrates: the "supply chain tensions " and " freight costs " components have turned green since the second half of 2022, even if the recent tensions in the Red Sea are starting to show! In the course of 2023, commodity and producer prices followed suit. Finally, consumer prices are also showing the first signs of greening, while inflation expectations are turning lighter red. Only the "labor market" block retains a "very" red hue ... with the notable exception of the quits rate which we discussed in a previous post.
If, as we believe, services and wage inflation are linked, further easing in the labor market is probably needed to bring US inflation close to the Federal Reserve's target.
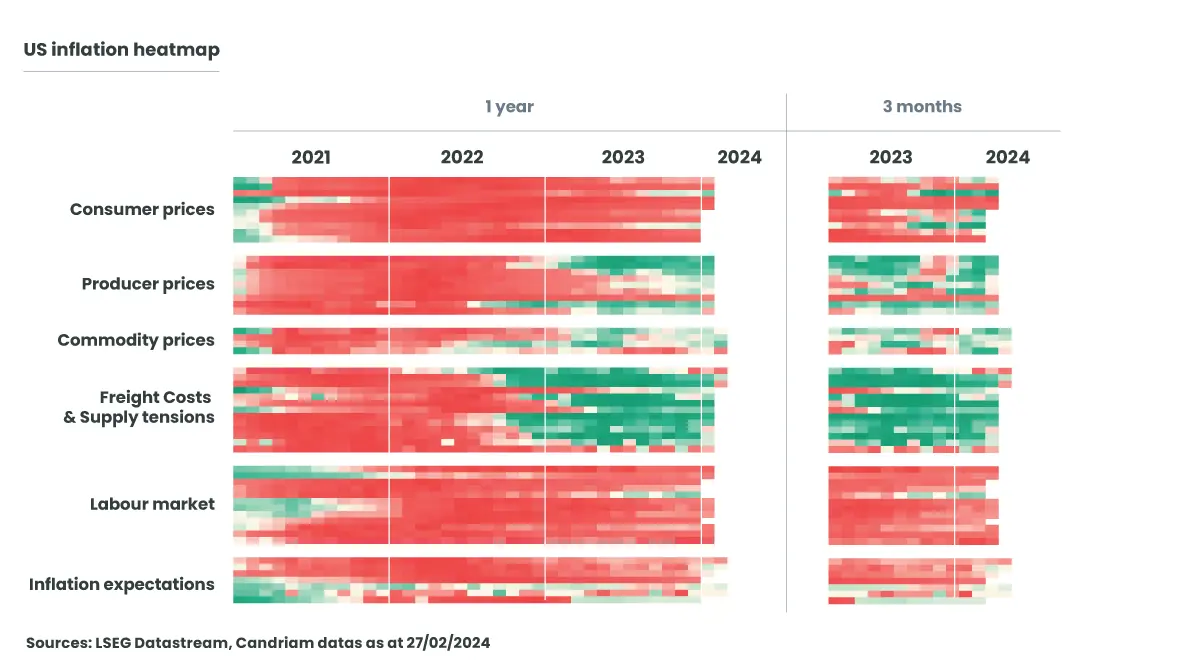
The color of the boxes depends on the position of the variable in its distribution since 1998. The green color indicates a position at the bottom of the distribution (for price inflation, wage inflation, etc.) or at the top of the distribution (unemployment rate, for example), and therefore signals an area of low inflationary pressure. At the opposite end of the color spectrum, red (high inflation, low unemployment) indicates a zone of high inflationary pressure. Points are awarded monthly.
For the sake of readability, we only display the blocks’ name. The detail of the components is given in the table below in order of appearance in the heatmap.
The "heatmap" above clearly illustrates, in the case of the United States, how far we've come in terms of disinflation. For several months now, the disinflation process seems to be well underway in most dimensions. However, persistent tensions on the labor market, both in the US and in the eurozone, should lead central banks to proceed with caution in easing their monetary policy. Following the last ECB communication, let's hope that the next Federal Reserve meetings on March 19-20 will continue to shed more light on the pace and scale of monetary policy easing to come... to be continued!