The disconnection between financial markets and the real economy has never seemed as wide as in 2020. Although the year is drawing to a close amid hopes of the second wave of the pandemic regressing in Europe, the hardest-hit of all the continents, the epidemic continues to spread worldwide with almost four million new cases recorded every week. An unprecedented downturn in global production is expected as a result. In October, the IMF was forecasting a 5.9% GDP contraction in the G7 countries, which is far greater than the -3.6% recorded during the 2009 financial crisis. However, the exceptional scale of the Covid-19 health crisis and its lasting repercussions are almost inconceivable judging solely by the performances[1] posted by equity markets (MSCI World indexTM +7.7%), high yield bonds (BofA Merrill Lynch Global High Yield Constrained indexTM +3.5%) and industrial metals (copper future contracts +17%). What factors account for this apparent disconnection between financial markets and the real world?
Financial markets rapidly anticipated a V-shaped recovery during the summer
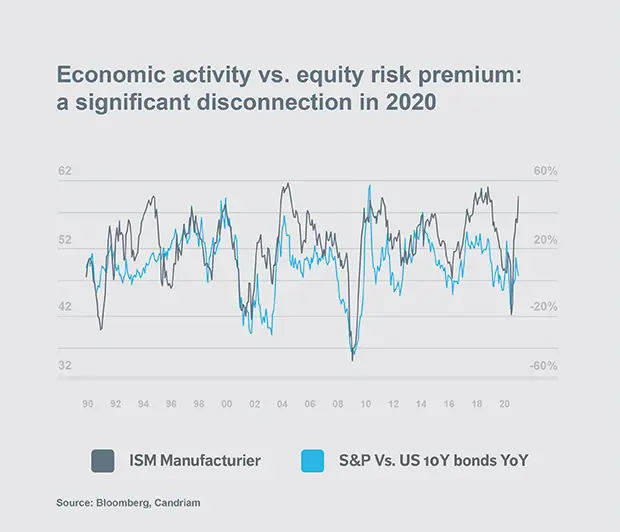
The economic downturn stemming from the health crisis differs greatly from the 2008-2009 recession. Business activity closed down abruptly but only temporarily. As the chart above illustrates, the ISM manufacturing indexTM in the US slumped from 49 at the end of March to 41.5 at the end of April. The slowdown was even sharper in Europe, with the manufacturing Purchasing Managers' Index (PMI) falling to 33 at the end of April, while the eurozone services PMI plummeted even further to 12. Conversely, a V-shaped recovery during the summer effectively took shape, with business activity bouncing back surprisingly sharply. In the US, the ISM manufacturing index surged back through the 50 level during June and hit 59 in October. The huge monetary and fiscal stimulus measures, which were put in place as early as March, account for the rapid recovery from the unprecedented economic shock. In 2008-2009, the ISM manufacturing index took almost 12 months to breach the 50 level once again.
Equity and bond indices unrepresentative of the real economy
Although the sudden shock triggered by the economic crisis is only temporary, it has had a highly uneven impact across different sectors. Entire swathes of the economy including transport, the tourist sector and the hotel & restaurant industry have been closed down, whereas other segments such as on-line services have profited from accelerated growth this year. The gap between the Covid winners and losers has widened steadily since March and is reflected in spectacularly different performances between companies.
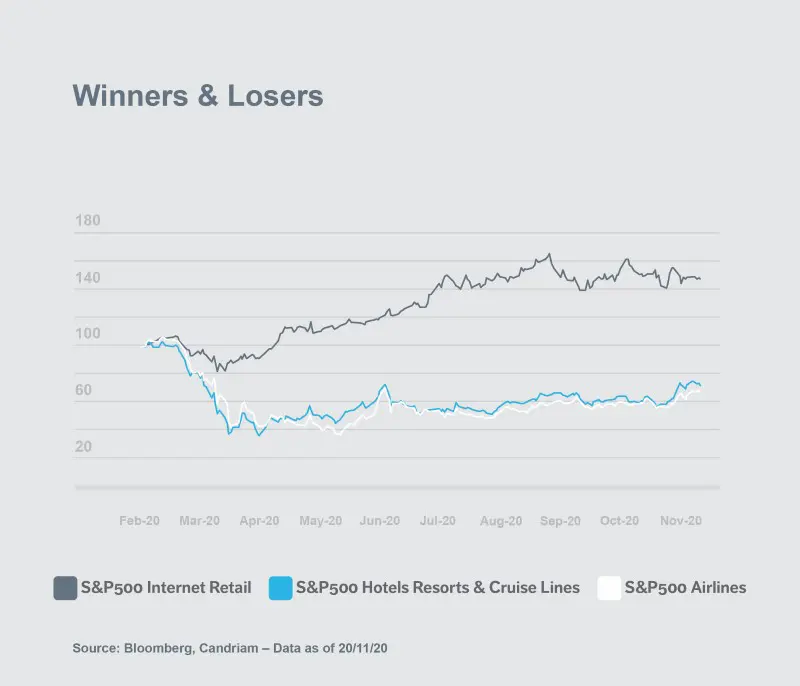
Within the S&P 500TM, the Internet sector (S&P500 Internet RetailTM) posted a positive performance of around +50%, while the hotel sector (S&P500 Hotels Resorts & Cruise linesTM) and aviation (S&P500 AirlinesTM) were down by around 28% and 33% respectively.[1]Companies which have gained from the health crisis are mainly growth stocks, either in the technology sector or in telecoms (social media) and the discretionary consumer segment (on-line sales). Prices among these stocks have been boosted by a positive scissors effect during the crisis, i.e. improved earnings outlook and falling interest rates. The weightings of these mega-cap stocks in the S&P 500 index in the US, which are the undisputed leaders in these sectors, have increased sharply. The combined weight of Google, Apple, Facebook, Amazon and Microsoft now represents over 20% of the index[2]. Amazon’s index weighting has nearly doubled this year to almost 5%. There has been a similar concentration among emerging indices, with four stocks now representing 25% of the MSCI Emerging Markets indexTM[3]. Bond indices are also reflecting the same trend, with 15% of issuers representing 50% of the market cap of the non-financial euro high yield index[4].
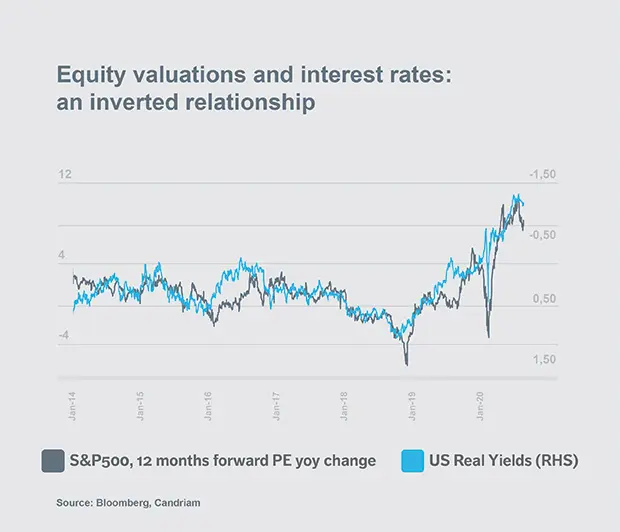
Has there really been a disconnection between financial markets and the real economy or between the market indices and the real economy? The heavy weighting of growth stocks has been amplified by the unprecedented fall in real US interest rates. Growth stock prices rise when interest rates ease, as companies’ future cashflow is discounted at a lower rate. Their weightings in the global indices therefore increase. The impact on the US index is illustrated in the chart below, with the S&P 500 twelve-month forward Price Earnings Ratio tracking the downward trend in real US interest rates (inversed scale on the chart).
Can we expect a partial re-connection over the coming year?
The key question over the next few months will be the pace of the recovery from the health crisis. The trading session on 9 November provided an insight into potential financial market trends for 2021. The interim vaccine test results announced by Pfizer-BioNTech, which demonstrated 90% efficacy, triggered an historic daily outperformance by value stocks over growth stocks.
In the case of the stocks referred to in the example above, Internet sector fell by 4%, while hotel sector rallied 19% and aviation sector gained 15% on the same day. A progressive exit from the health crisis and a recovery in economic activity should enable financial markets to post gains based on a broader spectrum of stocks which more closely represent the real economy. The impression of a disconnection should therefore diminish if similar position rotation continues next year.
However, the Covid-19 pandemic has nonetheless accelerated trends already perceptible before the crisis which were driving medium-term growth themes among tech stocks and in innovative and green sectors. In an environment where real interest rates are unable to steepen significantly, a gap will remain between financial markets and the real economy.
[1] Source Bloomberg, data on 20 November 2020 in USD
Past performances are not reliable indicators of future performances.Performances expressed in a currency other than that of the investor's country of residence are subject to exchange rate fluctuations, with a negative or positive impact on gains
[2]Source Bloomberg, data on 20 November 2020
[3] Source Bloomberg, data on 20 November. Top 25% MSCI EM: Alibaba, Tencent, TSMC and Samsung representing 8.8%, 6.7%, 5.7% and 3.7% of the index respectively.
[4] Source Bloomberg, data on 20 November.