
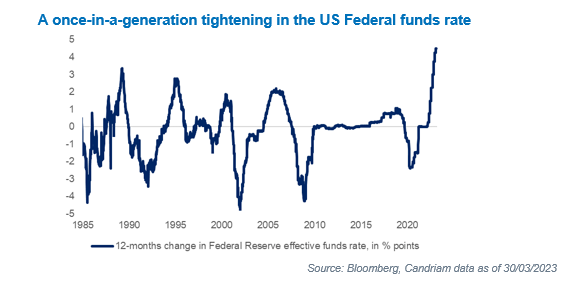
- The once-in-a-generation monetary tightening engineered by the US Federal Reserve (Fed) over the past twelve months has produced financial vulnerabilities.
- Additional reference rate hikes by central banks in March amid the banking turmoil show that there is no easy trade-off in ensuring both financial stability and price stability.
- As credit conditions are tightening, we acknowledge that the risk of a more adverse outcome than our soft-landing scenario has increased.
- We present the key indicators investors must watch to assess the financial health of small and local US banks and their potential impact on the economy.
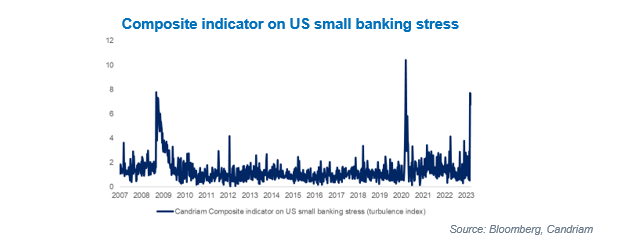
- We introduce a synthetic “turbulence” index gauging the stress among small US banks. It is pointing to severe – but fading – stress in March.
- At the current juncture, the overall systemic risks of the shock in the universe of local and small US banks appear manageable.
Tightening cycles and financial vulnerabilities
During March 2023, central banks on both sides of the Atlantic showed that there is no trade-off in their role of ensuring both financial stability and price stability: the European Central Bank (ECB) hiked its reference rate by 50 basis points (bps) to 3.50%, while the Fed added 25bps to its funds rate, bringing the size of the total US interest rate cycle to 450bps since it started on 16 March 2022. Most investors have never witnessed such a sharp tightening.
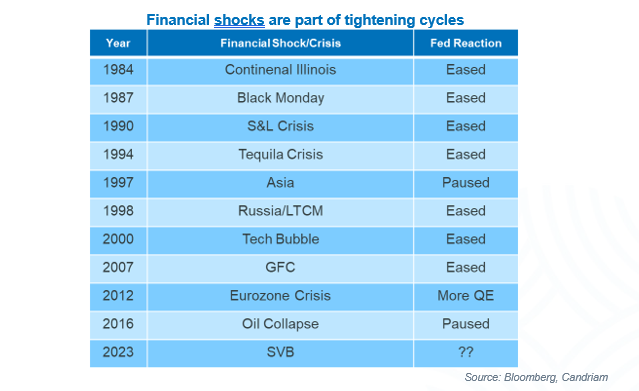
Empirical evidence reminds us that financial stress is part of tightening cycles, and central banks have regularly adjusted their monetary tightening to financial developments. The table below reminds us that financial shocks of the past decades and didn’t end until the Fed reacts, even with just a pause in its tightening cycle. At only three occasions the financial shocks triggered by monetary tightening ended up in an economic recession (1990, 2000 and 2007).
The prospect of slow economic growth both in the US and euro area remains our most likely, main scenario. However, we acknowledge that the risk of a more difficult situation has increased: the banking turmoil is likely to lead to a further tightening of financial conditions.
In the US, we think this tightening could lead to an additional 5% to 10% decline in commercial and industrial lending for the whole of 2023 (USD140bn to USD280bn declines in bank credit, or 0.5% to 1% of GDP). In the euro area, a tightening of credit conditions has started showing signs even before March, and we were expecting a 5% contraction of residential investment (-0.3% of GDP). Clearly this is just our current estimate and higher levels of tightening would lead to more serious consequences.
Keeping a watch, at high frequency
So how do we ensure that our view remains up to date? There exists which help us allow for ongoing monitoring of financial and market stress using a handful of useful indicators . Every week, we review the following data releases:
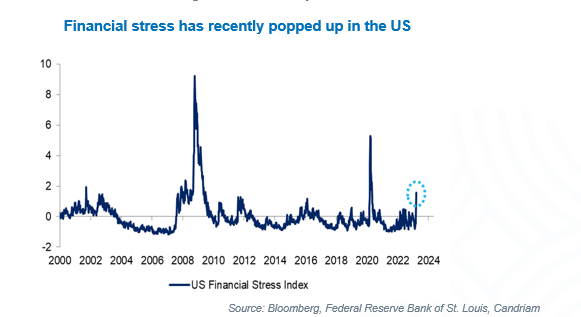
- A market-based systemic stress indicator developed and published by the Federal reserve Bank of St. Louis
- The evolution of US small banks’ deposits published in the “Assets and Liabilities of Commercial Banks in the United States” H.8 release of the Federal Reserve System
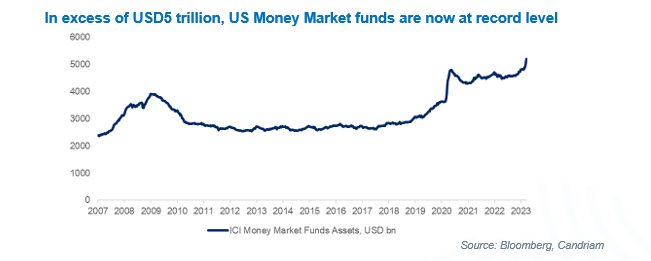
- The weekly flows into US money market funds, which have attracted record assets, hitting USD5.2trn at the end of March.
The market-based systemic financial stress indicator, published by the Federal reserve Bank of St. Louis, is a composite indicator regrouping 18 different data series: 7 interest rate series, 6 spread series and 5 other data series as Emerging market debt spreads, the real interest rate, the implied volatility on equities and bonds and the performance of the S&P Financials index. Currently, the overall stress in the system is about one fourth of what it was in the GFC, and less than half of what it was early in the Covid-19 pandemic.
Historically, banking turmoil is leading to further tightening of credit conditions. Swift action from authorities (such as the introduction of the new bank-term funding program by the Fed) can mitigate this risk of additional damage to the economy. Time is of the essence.
Bank customers recently withdrew significant deposits from their accounts held at small US banks - USD5bn of deposits in the week ended 8 March and additional USD108bn of deposits in the week ended 15 March[1]. This weekly outflow represented an unprecedented, “6-sigma event”[2].
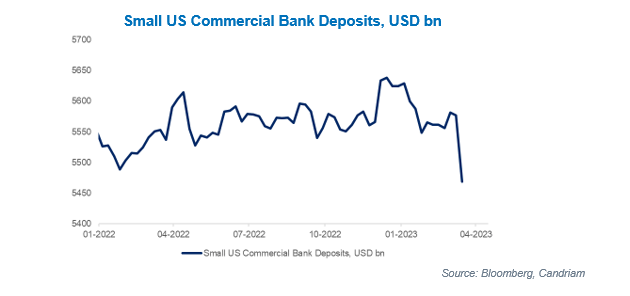
Bank customers shifted their deposits not only from smaller to large US banks (who attracted USD120bn deposit inflows in the week ended 15 March), but also into higher yielding money market funds. This data is published with a short lag on a weekly basis.
US money market fund assets rose by USD460bn since the start of this year, of which USD378bn in March! Hitting USD5.2trn at the end of March, they have attracted record assets.
The key take-away – gauging the current turbulence among small us banks
To evaluate specifically the turmoil among US small and local banks, we built a turbulence index based on the market-based financial stress index of the St. Louis Fed, deposit changes at small banks and flows into money market funds.
Our key findings from this exercise point to severe – but fading – stress in the US small banking sector compared to previous historical stress episodes:
- Week of 19/09/2008 – Bankruptcy of Lehman Brothers and acquisition of Merrill Lynch by Bank of America
- Week of 27/03/2020 – Covid-19 pandemic lockdowns
- Week of 17/03/2023 – Failure of SVB and Signature Bank
From an asset allocation point of view, considering both upside and downside risks in a binary situation, we keep a neutral view on equities after the downgrade in February, following the strong performance registered since we became overweight last October.
[1] Source: Federal Research Economic Data, as of 22/03/2023
[2] A 6-sigma event that is extremely rare, beyond the sixth standard deviation in a normal distribution, is known as a six sigma event. The probability of such an event happening would be about [2* 10^(-9)] or twice in a billion.