The United Nations conference in Glasgow, COP26, ended for many with a feeling of too little. Three economies generate more than half of greenhouse gas emissions. We plot out the gaps.
Still not on track for 1.5 degrees C
The stated objective of the COP26 was to accelerate the pace of CO2 emissions reduction in order to contain global warming within a range of 1.5°C to 2°C, while respecting the principle of 'subsidiarity', according to which each country organizes itself as it wishes and sets its own Nationally Determined Contribution (NDCs). According to Climate Action Tracker, the commitments should enable the world to limit warming to 2.4°C (compared to 2.7°C before the COP). To reach the 1.5°C target, global net CO2 emissions must be reduced by 45% by 2030 from 2010 levels, and decline to net zero by 2050. However, even achieving the latest NDCs would lead to a level of global greenhouse gas emissions in 2030 that is still higher than in 2010!
We all know the major players. Together, the United States and Europe contribute a quarter of global emissions (15% and 10% respectively), while China accounts for a little more than a quarter (27%). These three economies alone now emit more than half of all CO2.1
The Extra Effort Required -- Developed Nations
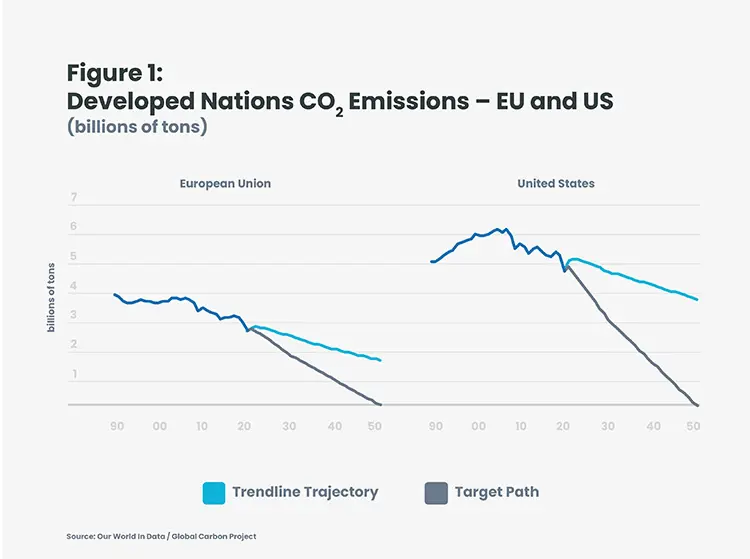
Starting from very different emission levels, Europe and the United States have similar objectives – to achieve carbon neutrality by 2050. To achieve this goal, the United States has set an intermediate 2030 target of a 50 to 52% reduction in emissions from 2005 levels, while Europe has set an interim target of a 55% reduction in emissions from 1990 levels. These targets are ambitious – maintaining the recent trend of carbon intensity reduction (CO2 emissions per unit of GDP) will not be enough! In 2050, without a more pronounced reduction in carbon intensity, emissions in both regions would be well above the carbon neutrality target (Figure 1).
The Path for China
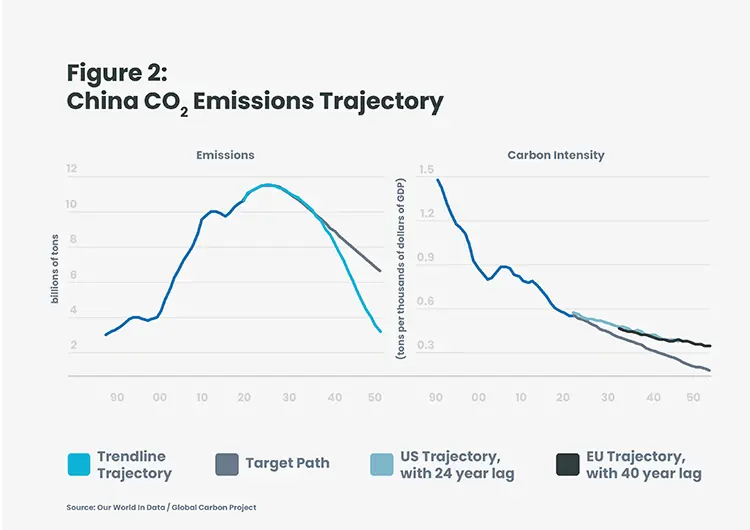
China's ambition is to be carbon neutral by 2060. Its target for 2030 is more modest -- it plans only to reduce its carbon intensity2, by 65% compared to 2005. Given China's continued economic development, its emissions would therefore continue to rise, peaking just before 2030. The effort required for these goals is nonetheless substantial. Compared to the rate of reduction of carbon intensity observed in the United States since 1996 (when US intensity was comparable to that of China today) or to that of the European Union, which began even earlier, the reduction in intensity announced by China still appears ambitious (Figure 2).
And That Gap Between 'Target' and 'Trajectory’?
The emissions graphs display a straight line 'Target' between where the nations are today, and their net zero goals. They also display a straight-line 'Trajectory' based on emission improvements actually achieved in the ten years prior to Covid-19.
And the gap? Assuming that we actually do achieve our targets, that growing gap hints at the size of the problem that financial markets must help address. Perhaps this is why Impact is such a popular word in today's investment vocabulary.
1 We might note that while these current emissions levels are relevant for projecting the future of global emissions, the history of emissions has some relevance to negotiating targets between developed and emerging nations. While today the US and Europe are contributing roughly a quarter of new emissions, over half of cumulative emissions already in the atmosphere came from these two regions. Conversely, while China may be contributing a fourth of new emissions, less than 13% of Greenhouse Gases already in the atmosphere are attributable to this nation.
2 Carbon intensity is the quantity of carbon emissions per dollar of GDP. This is a measure of the efforts realized by countries to decarbonize their economy. In countries that are developing fast, this reduction in carbon intensity can be compensated by high GDP growth -- this is especially the case for China where carbon intensity has been declining since the early 90s while carbon emissions have been increasing at the same time!